
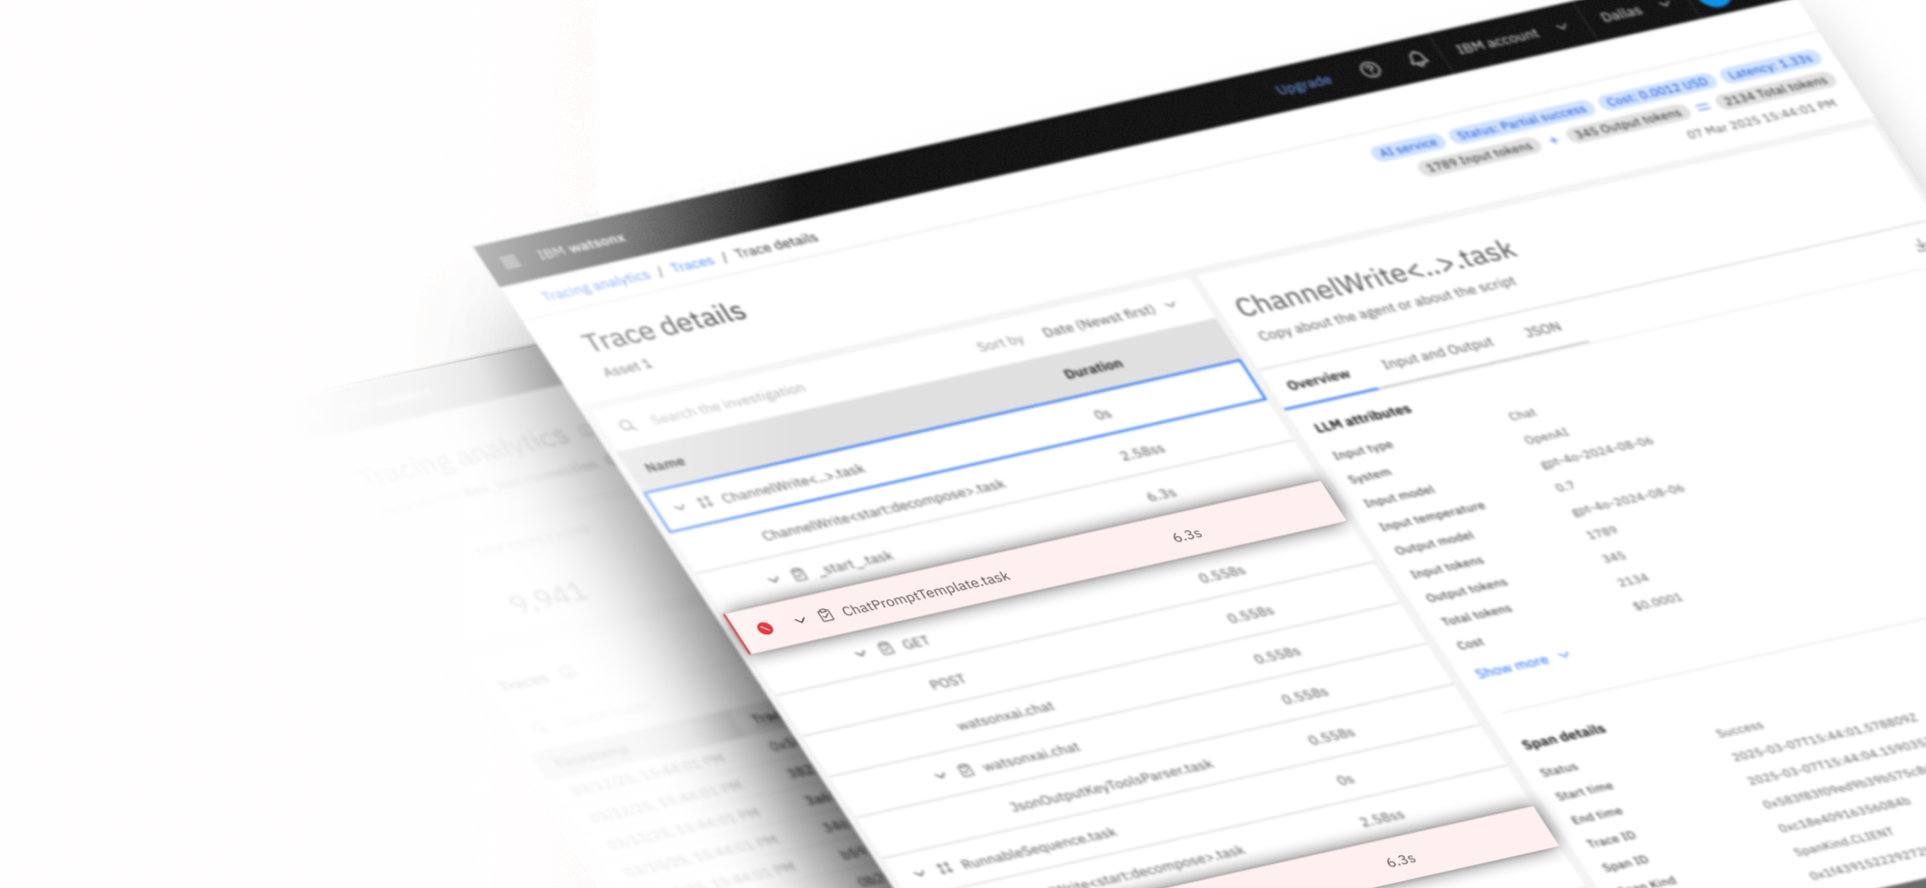
Troubleshooting and Monitoring Applications
in watsonx.ai
Enabling enterprise developers to optimize and analyze AI performance via automated tracing and observability.
OVERVIEW
We don't need more applications; we need better visibility.
Watsonx.ai has made it easier for developers to build AI solutions. But as these solutions grew more sophisticated, it also became harder to understand and troubleshoot.
Developers lacked visibility into how their applications executed, making it difficult to diagnose failures, track usage and costs, and effectively manage their expanding portfolio of AI applications.
Existing platforms weren’t designed to meet these unique needs, leaving developers without a clear understanding of what was happening behind the scenes.
I led the end-to-end design of a new observability and tracing experience that transformed complex AI behavior into clear, actionable insights.
ROLE
Product Designer
UX Designer
TIMELINE
6 months, 2025
SKILLS
Product design
UX design
TEAM
2 researchers
3 developers
CHALLENGE
How can we provide granular visibility into generative and agentic AI applications?
Granular visibility provides a detailed view of how an application runs, helping developers understand its behavior, identify issues, optimize performance, and reduce costs.
The challenge was integrating this capability into the watsonx.ai ecosystem in a way that scaled with evolving AI workflows and remained approachable for our users.
RESEARCH
Evaluating Existing Tools: IBM Instana
Before committing to building a new experience, we evaluated IBM Instana to determine if an existing IBM product could be extended.
While Instana was a mature observability platform, it would have required creating a separate setup for every user to keep data private, making the solution difficult to manage and scale.
As a result, we decided to design an experience directly within watsonx.ai that could better support developers.
Competitive Analysis
Rigorous competitive analysis identified common interaction patterns, usability best practices, and gaps in industry-leading observability tools.
3 key recommendations served as principles I used to inform information architecture, interaction patterns, and the overall MVP experience:
Adopt industry-leading patterns so users don’t have to learn a completely new way of working
Allow users to customize views based on what they need to see
Provide flexibility for users to explore and analyze information in ways that work best for them
EXPECTED OUTCOMES & USER GOALS
Hypothesis:
If we provide a centralized observability experience within watsonx.ai, developers will be able to monitor and analyze application performance.
This will be validated via usability testing and post-launch product analytics to measure engagement, task success, and ease of use.
User Goals
This experience needed to support 3 core goals:
So then, how might we…
MY DESIGN PROCESS
One major goal I had for the design of this experience involved longevity.
I wanted to create an MVP with a design foundation that future teams could build upon while maintaining usability, consistency, and product vision.
Throughout this process, I partnered closely with the UX research team, asking follow-up questions to understand their findings and uncover different opportunities I could use to guide the experience.
Also, I regularly reviewed iterations with my PM to gather feedback and ensure designs aligned with business goals.
DESIGN EXPLORATIONS
I used IBM’s design system, Carbon, to build mid-fidelity wireframes.
Each “How Might We” question became a user flow that connected back to research insights and user goals identified earlier in the process.
These connections helped ensure each design exploration was grounded in user needs and informed by research.
HMW 1: How might we surface the most important insights quickly?
This translated into a dashboard, highlighting metrics that developers value the most and including digestible visualizations.
Low-fidelity layout exploration: metrics at a glance, trace list preview, assorted charts
Trace failure callout & trace list preview to prompt action
Filter at-a-glance metrics by specific metric exploration
HMW 2: How might we help developers efficiently navigate large volumes of data?
This translated into a view where users could browse all traces generated by their AI applications and search or filter to find the ones they wanted to investigate further.
Live updates toggle enables real-time trace updates. The trace table displays key attributes and unique identifiers.
An added “Source” column shows which AI application each trace originated from.
Modular filtering concept
I explored and presented a modular filtering concept based on an industry-leading pattern that gave developers greater control over how they viewed and filtered traces, creating a more flexible and nuanced experience.
However, engineering determined it wasn't feasible within our MVP timeline, even though the design team supported this new interaction pattern.
User clicks the filter icon
User defines filter conditions like status, model, token consumption, etc.
Applied filters update the list of traces
Modular filter → filter panel expansion
I iterated on the concept to fit watsonx.ai’s existing filtering patterns while still preserving the original design intent.
Key UX updates:
Converted filters into expandable sections to improve scanability
Updated the order of sections based on selected filters for faster navigation
Added a search function within sections for users to find specific models or trace sources quickly
Automatically disabled Live Updates when a custom time range is applied to avoid conflicting states
watsonx.ai’s existing filter panel pattern
Expandable filter sections
Updated section order based on selections & ability to search within section where applicable
Live updates are disabled when time range is enabled
HMW 3: How might we help developers understand the details behind an AI interaction?
This is where users could analyze a trace in depth— understanding the interactions, visualizing hierarchy, and seeing how token usage, cost, and timing are broken down.
Information about this trace and a visual of how this trace is broken down by specific interactions
Addition of JSON tab after receiving feedback that developers appreciate the ability to copy code directly into their local environments
USABILITY TESTING
I partnered with the research team on one round of usability testing to identify opportunities for improvement and uncover any gaps in the mid-fidelity experience.
Key Insights:
Prioritize cost, latency, and token usage
Add stronger visual cues to identify key information quickly
Include contextual guides like tooltips and links to documentation
Allow users to customize dashboard views
Surface insights proactively and highlight areas that need attention
With the launch deadline rapidly approaching, I prioritized feedback based on low-effort, high-impact adjustments:
HIGH FIDELITY DESIGNS
DASHBOARD
TRACE TABLE WITH FILTER
TRACE DETAILS
RETROSPECTIVE
The biggest open question I was left with centered on the filtering capability.
While the MVP filter panel met technical constraints and preserved the core user goals, I didn't yet know whether it meaningfully improved developers' experience compared to the original modular concept.
That was a question to explore through user interviews after launch, alongside whether the modular filtering pattern is worth revisiting as a future capability.
GLOSSARY
Observability: seeing what’s happening inside an AI application in real-time to understand how well it’s working and why it’s behaving a certain way.
Tracing: one aspect of observability; it captures step-by-step records (traces) of what an application does as it runs.
Trace: a complete record of one AI interaction: what a user asked, what the model did, and what happened next.
Watsonx.ai: IBM’s enterprise AI development studio that helps developers create, customize, test, and launch AI applications – all in one place.