At a glance
Role
Product Designer
Team
1 UX Designer, 1 Design Lead, 3 Developers, 2 UX Researchers, 1 Writer, 2 PMs, 1 SME
Timeline
6 months, 2025
Skills
UX/UI design, product design, wireframing, data visualization, information architecture
Challenge
IBM’s existing observability tools don’t fully meet developers’ needs for a granular understanding of LLM behavior in workflows.
The goal was to build an experience within watsonx.ai for enterprise developers to enhance AI observability and debugging.
Solution
I led the end-to-end design of a high-priority MVP experience that reveals key AI application metrics: steps executed, token consumption, and step-level latency.
impact
💥 Delivered a private beta MVP experience, unveiled at the 2025 IBM Think Conference
💥 Designs reached an audience of 60+ IBMers spanning multiple product teams weekly
background
Problem statement
How can developers gain deeper visibility into generative AI applications deployed within watsonx.ai to extract actionable insights and effectively monitor and debug application behavior?
Business Opportunity
We aimed to create a novel experience that enables developers to manage their agent ecosystem.
Research
Before the design team brainstormed any ideas for this experience, our research team completed and presented to us a UX competitive analysis of 6 different competitors offering similar advanced tracing and observability capabilities.
The goal of the study was to understand what competitors offer in terms of existing UX patterns and identify opportunities to enhance observability tooling with improved UX patterns for developers.
Persona
A developer who needs capabilities to help them debug and evaluate agents, identifying and resolving issues both in development and production quickly.
User stories
Industry standard patterns
Design Requirements
I was responsible for the design of the visual interfaces that would serve as the way developers would monitor and analyze their LLM applications:
✅
Dashboard page
Users can view essential aggregated metrics like traces, latency, tokens, cost, and models.
✅
Trace management page
Users can view all logged traces and customize trace views/metrics.
✅
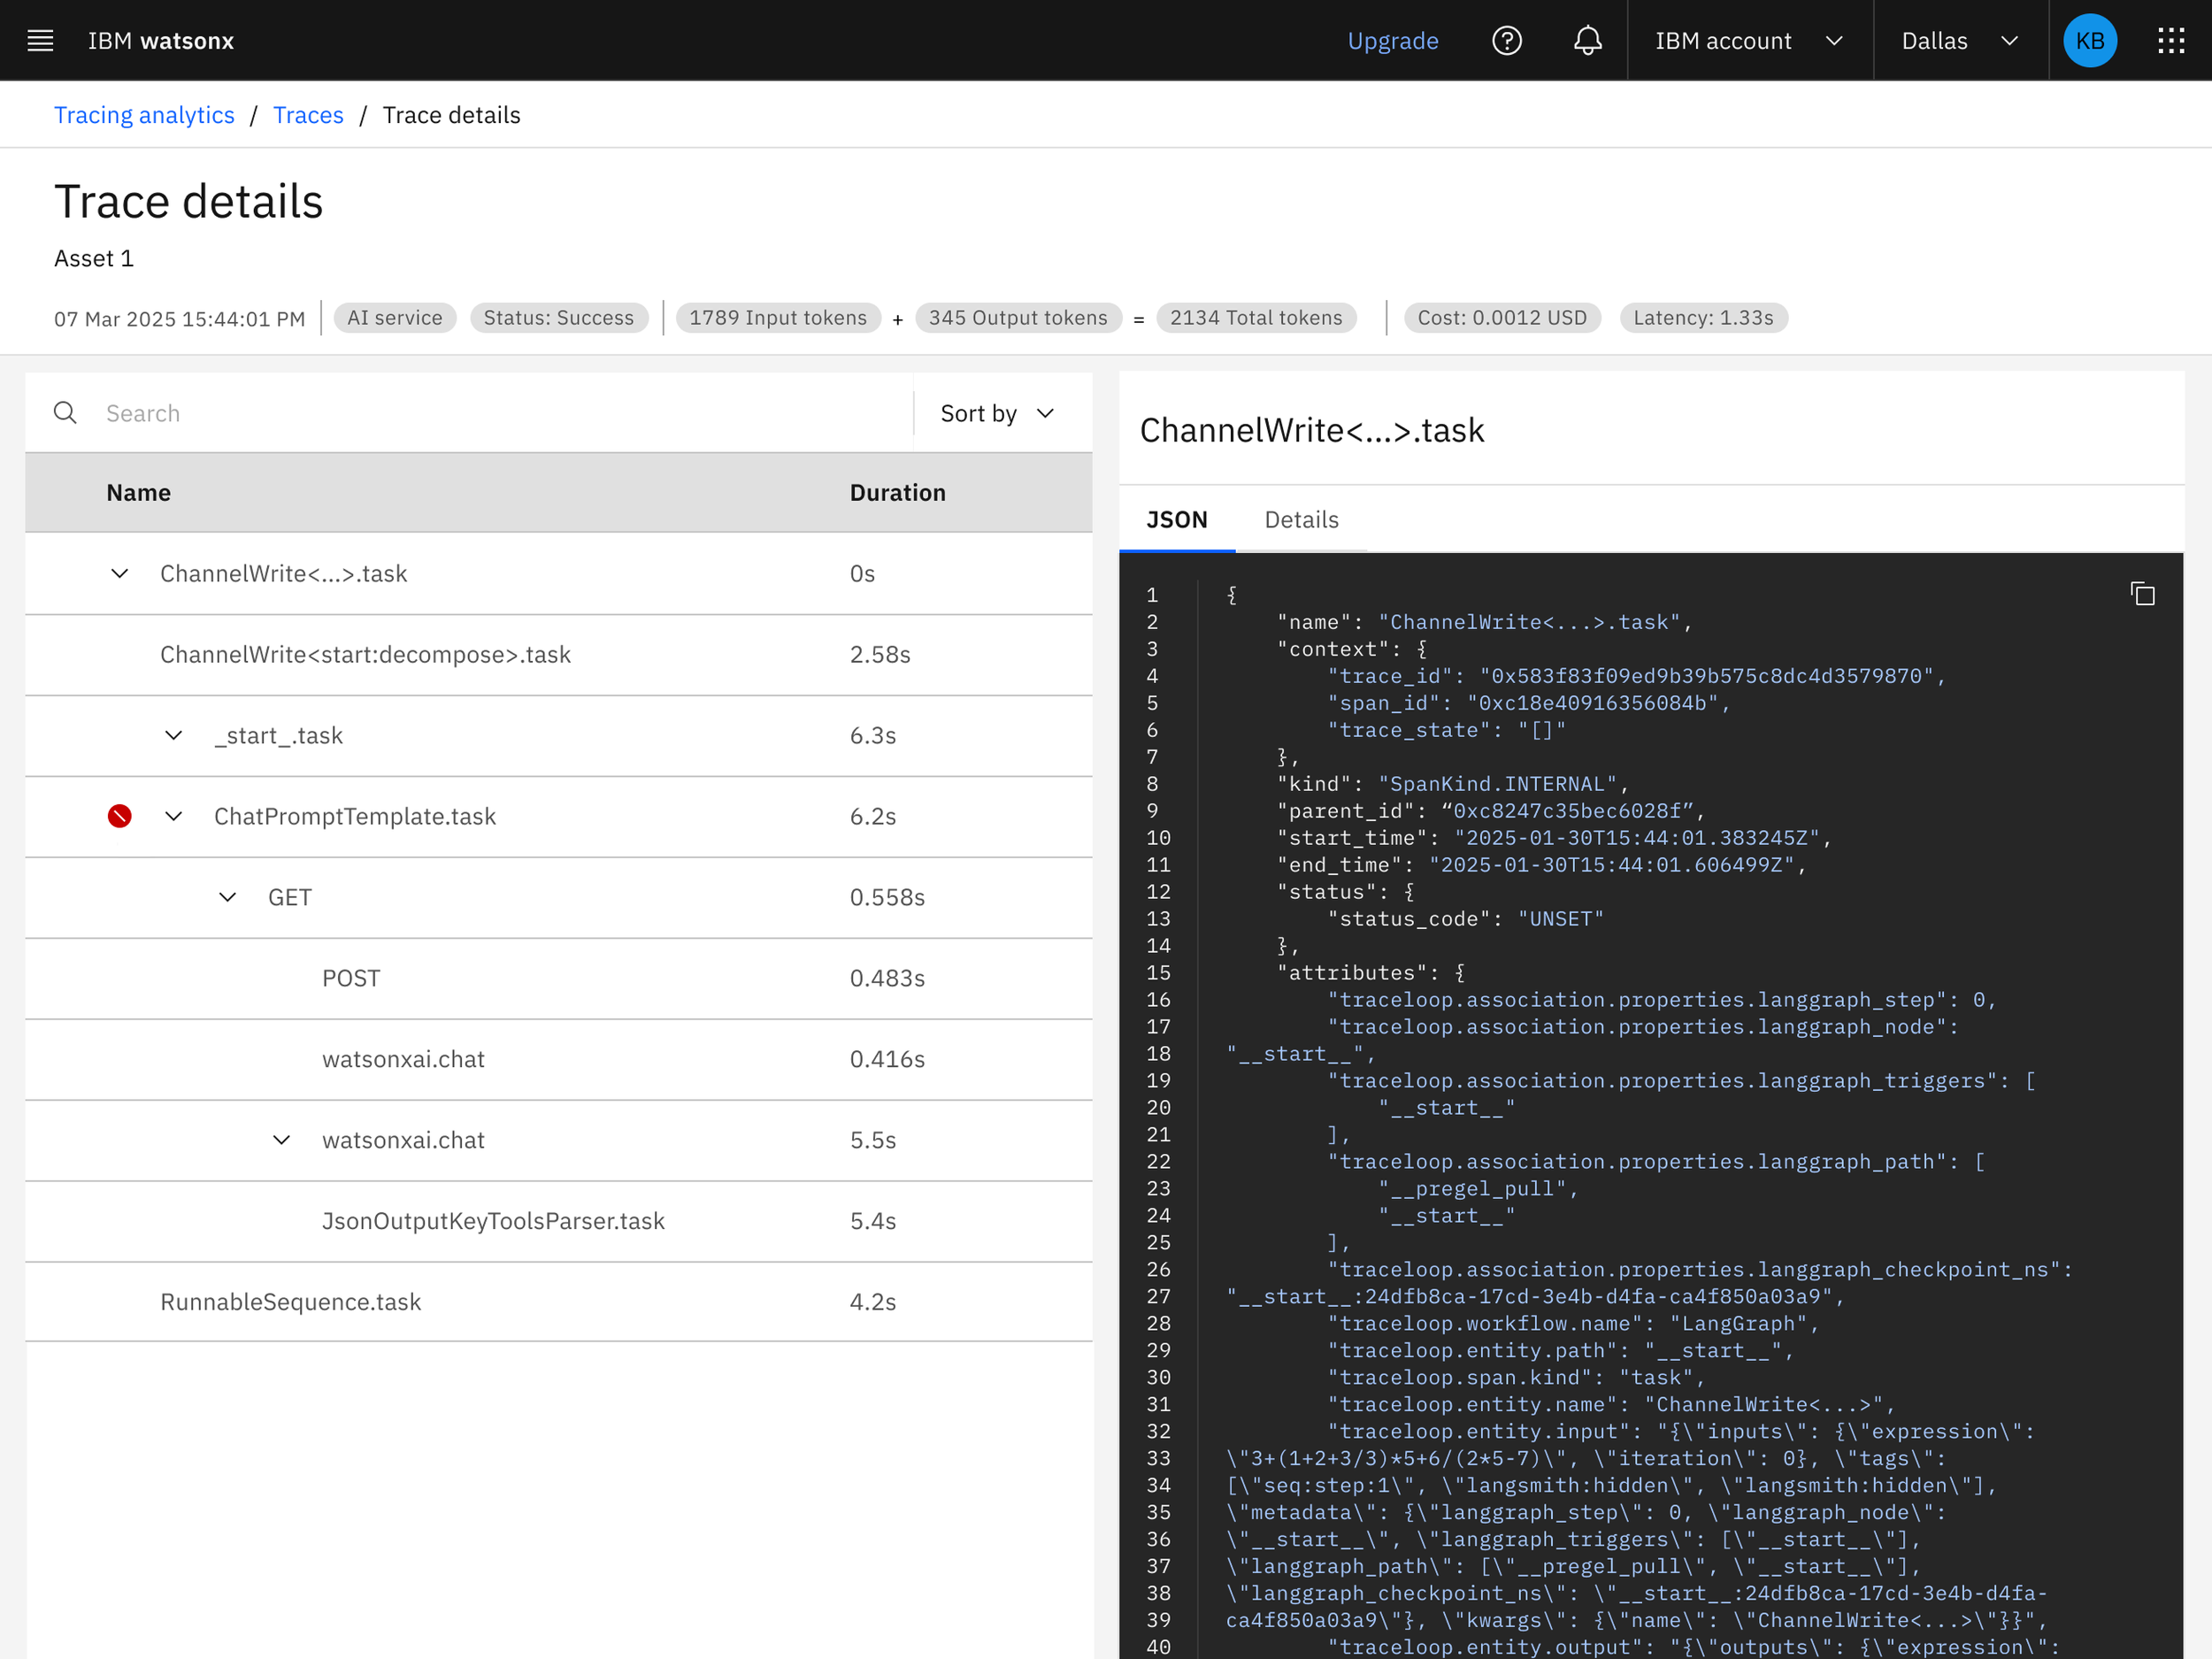
Trace details page
A deep dive into a specific trace, its associated metrics, and span-level data.
Design explorations
Guided by research, I collaborated with my design lead, product manager, and engineering leads to create mid-fidelity wireframes that captured the required features for MVP.
I explored feature variations (e.g., filtering, dashboard view, etc.) to determine which aligned best with user expectations and existing platform patterns.
Dashboard iterations
Early wireframes focused more on layout and element placement than on the content itself.
The data visualization evolved as the design matured and as users expressed specific needs for the dashboard.
Filtering
Initially, I considered using a modular filter system to follow industry standards.
I switched to using the platform-wide filter panel pattern since it aligned with users' existing mental models.
Concept testing
I partnered with our UX researchers on one round of concept testing.
The goal was to identify opportunities for improvement and uncover any gaps in the current mid-fi experience. Additionally, this goal allowed us to validate design assumptions for post-MVP. The main flows tested were a trace configuration flow, the dashboard experience, and the trace details flow.
Key insights
🚀
User desires to customize or rearrange the static dashboard.
🚀
Cost was consistently prioritized over success rate.
🚀
Stronger visual cues to identify key information quickly.
🚀
Adding contextual help in the form of tooltips and links to documentation.
Several findings were intended for post-MVP releases; it was reassuring to see that they aligned with directions I was already exploring. However, due to technical limitations and time constraints, some participant feedback couldn’t be incorporated into the final designs.
After concept testing, I quickly iterated on the designs to address low-effort, high-impact feedback.
Solution
The tracing experience entered a private beta phase. However, the MVP designs were implemented and instrumented, setting the foundation for future analysis as adoption increases.
Reflection 💡
What did I learn?
Explain with purpose - As tracing and observability were relatively new concepts for the broader team, I learned to concisely explain their role in our agentic products, often to large, cross-functional audiences with little context. While still building my own understanding, I had to clearly and efficiently describe these concepts to ensure my designs were grounded in context and prompt the right feedback and questions during presentations.
Own your designs - Stepping into the lead designer role challenged me to take full ownership of the design process confidently. It wasn't easy, as I sometimes didn’t have immediate answers, but I embraced those moments as opportunities to learn and then lead with more clarity.
Even the experts get “stumped” - As technical requirements rapidly evolved, I collaborated closely with technical leads to integrate external technology into watsonx, balancing user experience with implementation constraints. My designs depended on SDKs and components the development team had to implement; when integration proved challenging, it made settling on a single solution equally difficult for me. This served as a valuable reminder that no one has all the answers and the importance of working through ambiguity together.


